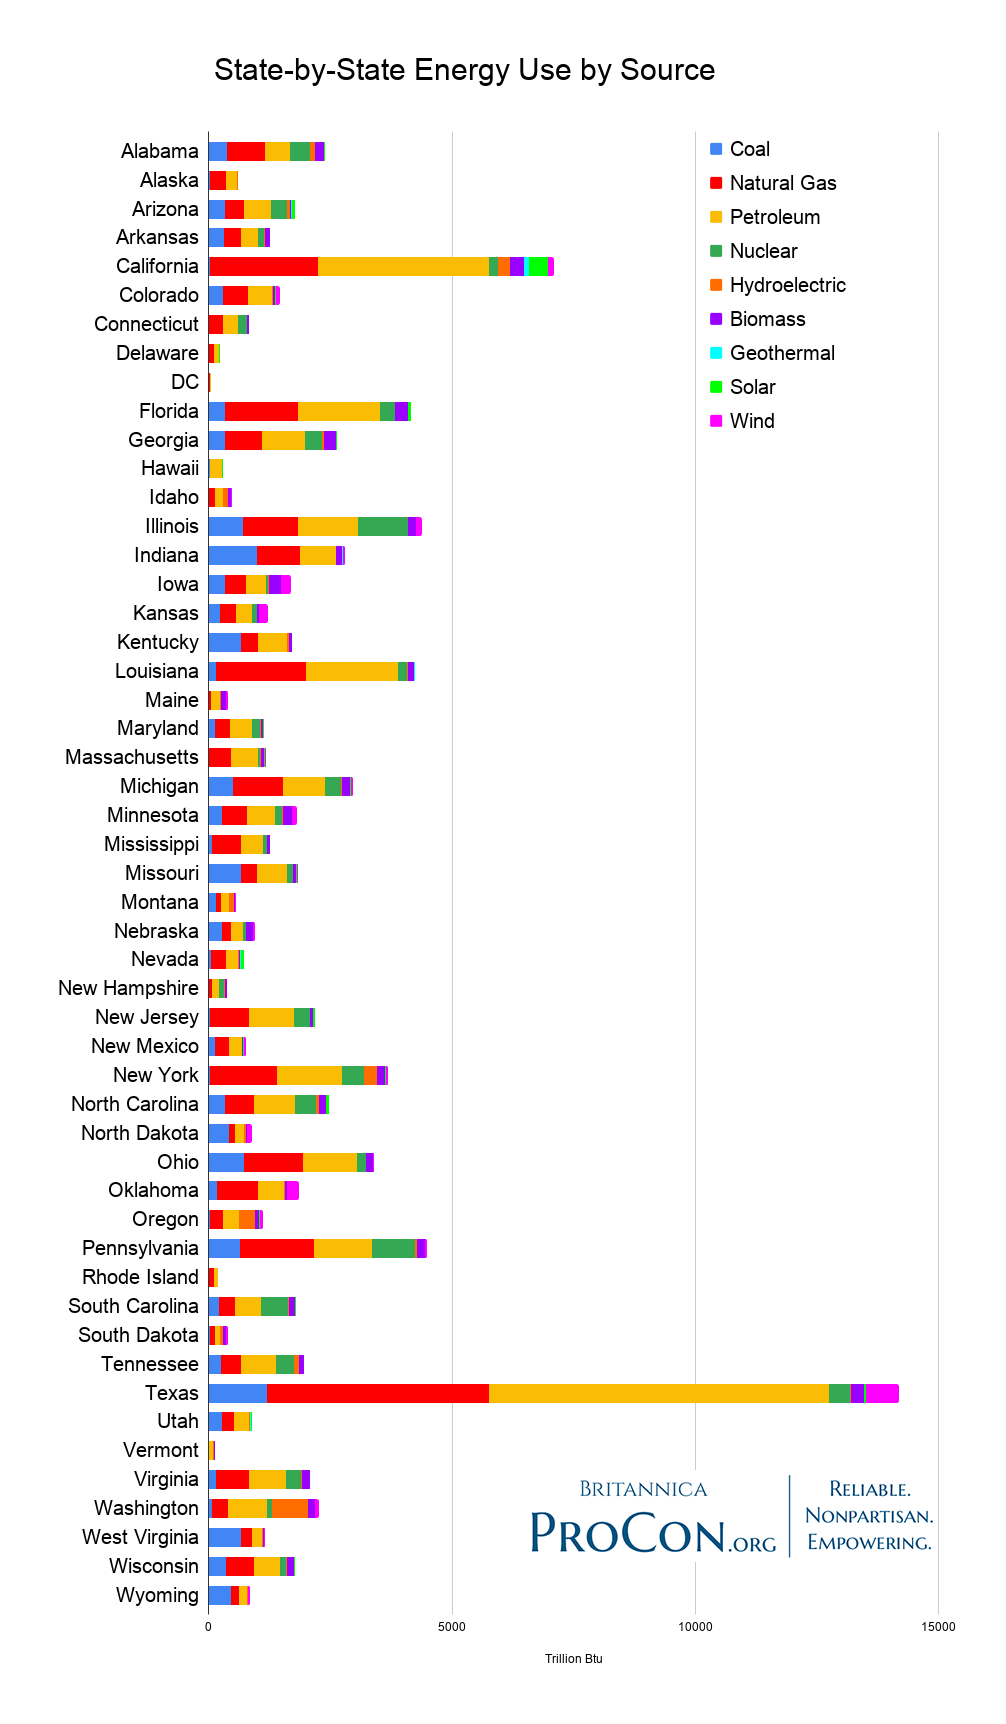
Each US state relies on fossil fuels, nuclear, and renewable energy in different proportions. Texas, for example used the most of all fossil fuels (coal, natural gas, and petroleum) in 2018, but is also the top consumer of wind power. California consumed the most biomass, geothermal, and solar power, while Washington used the most hydroelectric power and Illinois the most nuclear power.
Below, find tables and charts detailing each states’ use of each source of energy in 2018 (the most recent available data), as well as total energy consumption as compared to the states’ populations in 2018.
For energy use by the country as a whole, please see “United States Energy Use by Source.”
2018 State-by State Fossil Fuel Energy Consumption
(trillions of Btu)
According to the US Energy Information Administration, “A British thermal unit (Btu) is a measure of the heat content of fuels or energy sources. It is the quantity of heat required to raise the temperature of one pound of liquid water by 1 degree Fahrenheit at the temperature that water has its greatest density (approximately 39 degrees Fahrenheit).”
| State | Coal | Natural Gas | Petroleum | Total Fossil Fuels |
|---|---|---|---|---|
| Alabama | 377.2 | 770.9 | 519.6 | 1667.6 |
| Alaska | 17.3 | 346.3 | 221.2 | 584.8 |
| Arizona | 331.5 | 400.6 | 539.5 | 1,271.6 |
| Arkansas | 304.1 | 366.9 | 329.9 | 1,001.0 |
| California | 33.3 | 2,207.4 | 3,512.8 | 5,753.5 |
| Colorado | 284.5 | 519.6 | 501.0 | 1,305.1 |
| Connecticut | 4.0 | 286.0 | 312.7 | 602.7 |
| Delaware | 4.3 | 99.4 | 109.4 | 213.1 |
| DC | 0.0 | 32.6 | 19.0 | 51.7 |
| Florida | 327.8 | 1,511.1 | 1,688.0 | 3,526.9 |
| Georgia | 340.2 | 759.3 | 876.3 | 1,975.8 |
| Hawaii | 14.4 | 0.2 | 247.2 | 261.8 |
| Idaho | 2.8 | 115.8 | 180.8 | 299.4 |
| Illinois | 704.6 | 1,127.5 | 1,228.6 | 3,060.6 |
| Indiana | 985.7 | 890.4 | 741.1 | 2,617.2 |
| Iowa | 325.7 | 431.5 | 413.4 | 1,170.5 |
| Kansas | 227.7 | 321.4 | 345.6 | 894.6 |
| Kentucky | 655.9 | 356.5 | 604.1 | 1,616.5 |
| Louisiana | 137.8 | 1,860.7 | 1,897.0 | 3,895.5 |
| Maine | 2.1 | 48.4 | 173.6 | 224.1 |
| Maryland | 124.2 | 313.0 | 448.5 | 885.7 |
| Massachusetts | 0.1 | 452.6 | 561.5 | 1,014.2 |
| Michigan | 506.1 | 1,010.8 | 877.4 | 2,394.3 |
| Minnesota | 261.5 | 514.5 | 582.6 | 1,358.6 |
| Mississippi | 60.0 | 591.4 | 465.2 | 1,116.6 |
| Missouri | 668.2 | 329.8 | 610.7 | 1,608.7 |
| Montana | 152.3 | 90.8 | 172.7 | 415.8 |
| Nebraska | 264.1 | 196.4 | 242.3 | 702.8 |
| Nevada | 35.0 | 310.8 | 259.8 | 605.6 |
| New Hampshire | 7.8 | 51.5 | 155.2 | 214.4 |
| New Jersey | 16.7 | 799.6 | 935.1 | 1,751.4 |
| New Mexico | 136.8 | 281.2 | 259.4 | 677.4 |
| New York | 16.7 | 1,393.7 | 1,328.9 | 2,739.3 |
| North Carolina | 325.1 | 599.3 | 838.4 | 1,762.8 |
| North Dakota | 407.3 | 130.5 | 189.9 | 727.6 |
| Ohio | 717.8 | 1,211.9 | 1,110.5 | 3,040.2 |
| Oklahoma | 171.3 | 834.6 | 538.7 | 1,544.5 |
| Oregon | 16.9 | 271.3 | 332.9 | 621.1 |
| Pennsylvania | 644.1 | 1,513.2 | 1,203.2 | 3,360.4 |
| Rhode Island | 0.0 | 104.7 | 84.4 | 189.2 |
| South Carolina | 205.2 | 336.8 | 529.4 | 1,071.4 |
| South Dakota | 27.6 | 95.5 | 114.4 | 237.6 |
| Tennessee | 251.8 | 403.5 | 719.5 | 1,374.8 |
| Texas | 1,189.3 | 4,564.1 | 6,998.9 | 12,752.2 |
| Utah | 273.1 | 253.5 | 303.4 | 830.0 |
| Vermont | 0.0 | 14.2 | 76.3 | 90.6 |
| Virginia | 149.3 | 666.9 | 776.4 | 1,592.6 |
| Washington | 61.2 | 334.8 | 801.3 | 1,197.2 |
| West Virginia | 661.8 | 222.9 | 218.6 | 1,103.2 |
| Wisconsin | 362.1 | 565.3 | 543.1 | 1,470.4 |
| Wyoming | 455.7 | 174.9 | 162.6 | 793.2 |
| United States | 13,250.0 | 31,086.4 | 36,901.6 | 81,212.3 |
2018 State-by State Nuclear Energy Consumption
(trillions of Btu)
| State | Nuclear |
|---|---|
| Alabama | 412.6 |
| Alaska | 0.0 |
| Arizona | 325.1 |
| Arkansas | 133 |
| California | 190.4 |
| Colorado | 0.0 |
| Connecticut | 176.5 |
| Delaware | 0.0 |
| DC | 0.0 |
| Florida | 306.5 |
| Georgia | 359.3 |
| Hawaii | 0.0 |
| Idaho | 0.0 |
| Illinois | 1,025.7 |
| Indiana | 0.0 |
| Iowa | 51.2 |
| Kansas | 95.9 |
| Kentucky | 0.0 |
| Louisiana | 179.3 |
| Maine | 0.0 |
| Maryland | 156.7 |
| Massachusetts | 46.4 |
| Michigan | 318.7 |
| Minnesota | 152.7 |
| Mississippi | 72.3 |
| Missouri | 111.4 |
| Montana | 0.0 |
| Nebraska | 58.9 |
| Nevada | 0.0 |
| New Hampshire | 105.2 |
| New Jersey | 334.4 |
| New Mexico | 0.0 |
| New York | 448.7 |
| North Carolina | 439.9 |
| North Dakota | 0.0 |
| Ohio | 191.5 |
| Oklahoma | 0.0 |
| Oregon | 0.0 |
| Pennsylvania | 872.7 |
| Rhode Island | 0.0 |
| South Carolina | 551.2 |
| South Dakota | 0.0 |
| Tennessee | 378.2 |
| Texas | 430.6 |
| Utah | 0.0 |
| Vermont | 0.0 |
| Virginia | 305.8 |
| Washington | 101.5 |
| West Virginia | 0.0 |
| Wisconsin | 105.9 |
| Wyoming | 0.0 |
| United States | 8,438.1 |
2018 State-by State Renewable Energy Consumption
(trillions of Btu)
| State | Hydroelectric | Biomass | Geothermal | Solar | Wind | Total Renewable Energy |
|---|---|---|---|---|---|---|
| Alabama | 101.4 | 193.4 | 0.1 | 3.4 | 0.0 | 298.4 |
| Alaska | 15.2 | 8.2 | 0.2 | 0.0 | 1.4 | 25.0 |
| Arizona | 63.6 | 38.9 | 0.3 | 70.8 | 4.8 | 178.5 |
| Arkansas | 27.4 | 93.5 | 0.8 | 2.1 | 0.0 | 123.8 |
| California | 239.7 | 296.9 | 108.4 | 381.7 | 127.7 | 1154.5 |
| Colorado | 16.6 | 43.2 | 0.8 | 15.3 | 88.7 | 164.6 |
| Connecticut | 5.1 | 38.7 | 0.0 | 6.5 | 0.1 | 50.4 |
| Delaware | 0.0 | 6.1 | 0.4 | 1.5 | 0.0 | 8.0 |
| DC | 0.0 | 2.0 | 0.0 | 0.7 | 0.0 | 2.7 |
| Florida | 2.1 | 251.8 | 10.1 | 53.5 | 0.0 | 317.5 |
| Georgia | 33.7 | 247.5 | 0.3 | 21.0 | 0.0 | 302.4 |
| Hawaii | 0.9 | 10.7 | 1.0 | 13.1 | 5.5 | 31.1 |
| Idaho | 100.4 | 46.7 | 2.3 | 5.4 | 24.2 | 178.9 |
| Illinois | 1.3 | 170.3 | 2.0 | 2.7 | 108.3 | 284.7 |
| Indiana | 2.0 | 126.0 | 4.6 | 3.7 | 49.5 | 185.9 |
| Iowa | 8.4 | 258.1 | 1.3 | 1.3 | 194.2 | 463.4 |
| Kansas | 0.2 | 46.6 | 1.0 | 0.3 | 172.1 | 220.3 |
| Kentucky | 40.2 | 58.4 | 2.7 | 0.7 | 0.0 | 102.1 |
| Louisiana | 10.7 | 140.2 | 1.8 | 2.2 | 0.0 | 155.0 |
| Maine | 29.7 | 108.2 | 0.1 | 0.8 | 21.7 | 160.4 |
| Maryland | 25.8 | 47.4 | 0.6 | 11.5 | 5.2 | 90.4 |
| Massachusetts | 10.3 | 63.8 | 0.9 | 28.2 | 2.0 | 105.2 |
| Michigan | 14.3 | 179.0 | 5.2 | 2.3 | 49.7 | 250.4 |
| Minnesota | 9.6 | 183.5 | 1.1 | 10.4 | 97.5 | 302.2 |
| Mississippi | 0.0 | 72.8 | 1.0 | 3.1 | 0.0 | 76.8 |
| Missouri | 7.5 | 71.8 | 0.4 | 3.0 | 25.8 | 108.5 |
| Montana | 103.8 | 22.8 | 0.3 | 0.5 | 19.6 | 147.1 |
| Nebraska | 12.6 | 128.8 | 1.2 | 0.4 | 50.5 | 193.5 |
| Nevada | 17.1 | 15.7 | 33.1 | 48.6 | 2.8 | 117.3 |
| New Hampshire | 12.3 | 45.0 | 0.0 | 1.1 | 3.7 | 62.1 |
| New Jersey | 0.3 | 57.7 | 0.5 | 28.2 | 0.2 | 86.9 |
| New Mexico | 1.4 | 23.1 | 0.5 | 14.8 | 55.5 | 95.2 |
| New York | 269.8 | 165.2 | 1.2 | 17.7 | 36.4 | 490.3 |
| North Carolina | 60.1 | 149.3 | 1.0 | 57.8 | 4.9 | 273.2 |
| North Dakota | 29.0 | 32.9 | 1.0 | 0.0 | 97.7 | 160.5 |
| Ohio | 2.2 | 134.2 | 3.4 | 2.8 | 15.9 | 158.6 |
| Oklahoma | 18.5 | 49.8 | 0.0 | 0.7 | 248.9 | 317.9 |
| Oregon | 322.7 | 95.0 | 2.8 | 8.5 | 67.8 | 496.8 |
| Pennsylvania | 38.8 | 172.6 | 2.2 | 5.1 | 32.5 | 251.2 |
| Rhode Island | 0.0 | 7.3 | 0.1 | 1.2 | 1.4 | 10.0 |
| South Carolina | 27.4 | 128.5 | 0.6 | 6.9 | 0.0 | 163.5 |
| South Dakota | 57.0 | 64.8 | 1.9 | 0.0 | 25.8 | 149.5 |
| Tennessee | 93.7 | 109.3 | 0.2 | 2.4 | 0.4 | 206.0 |
| Texas | 10.3 | 270.8 | 2.5 | 36.3 | 689.2 | 1,009.0 |
| Utah | 8.4 | 16.9 | 4.9 | 23.9 | 7.2 | 61.3 |
| Vermont | 11.5 | 27.0 | 0.0 | 2.3 | 3.4 | 44.2 |
| Virginia | 16.1 | 155.5 | 1.7 | 8.2 | 0.0 | 181.5 |
| Washington | 736.4 | 145.9 | 1.1 | 1.5 | 71.9 | 956.8 |
| West Virginia | 16.8 | 20.6 | 0.0 | 0.1 | 16.1 | 53.7 |
| Wisconsin | 21.8 | 161.0 | 0.6 | 1.3 | 14.9 | 199.6 |
| Wyoming | 8.9 | 8.4 | 0.7 | 0.1 | 36.9 | 54.9 |
| United States | 2,663.1 | 5,011.7 | 208.9 | 915.5 | 2,482.4 | 11,281.6 |
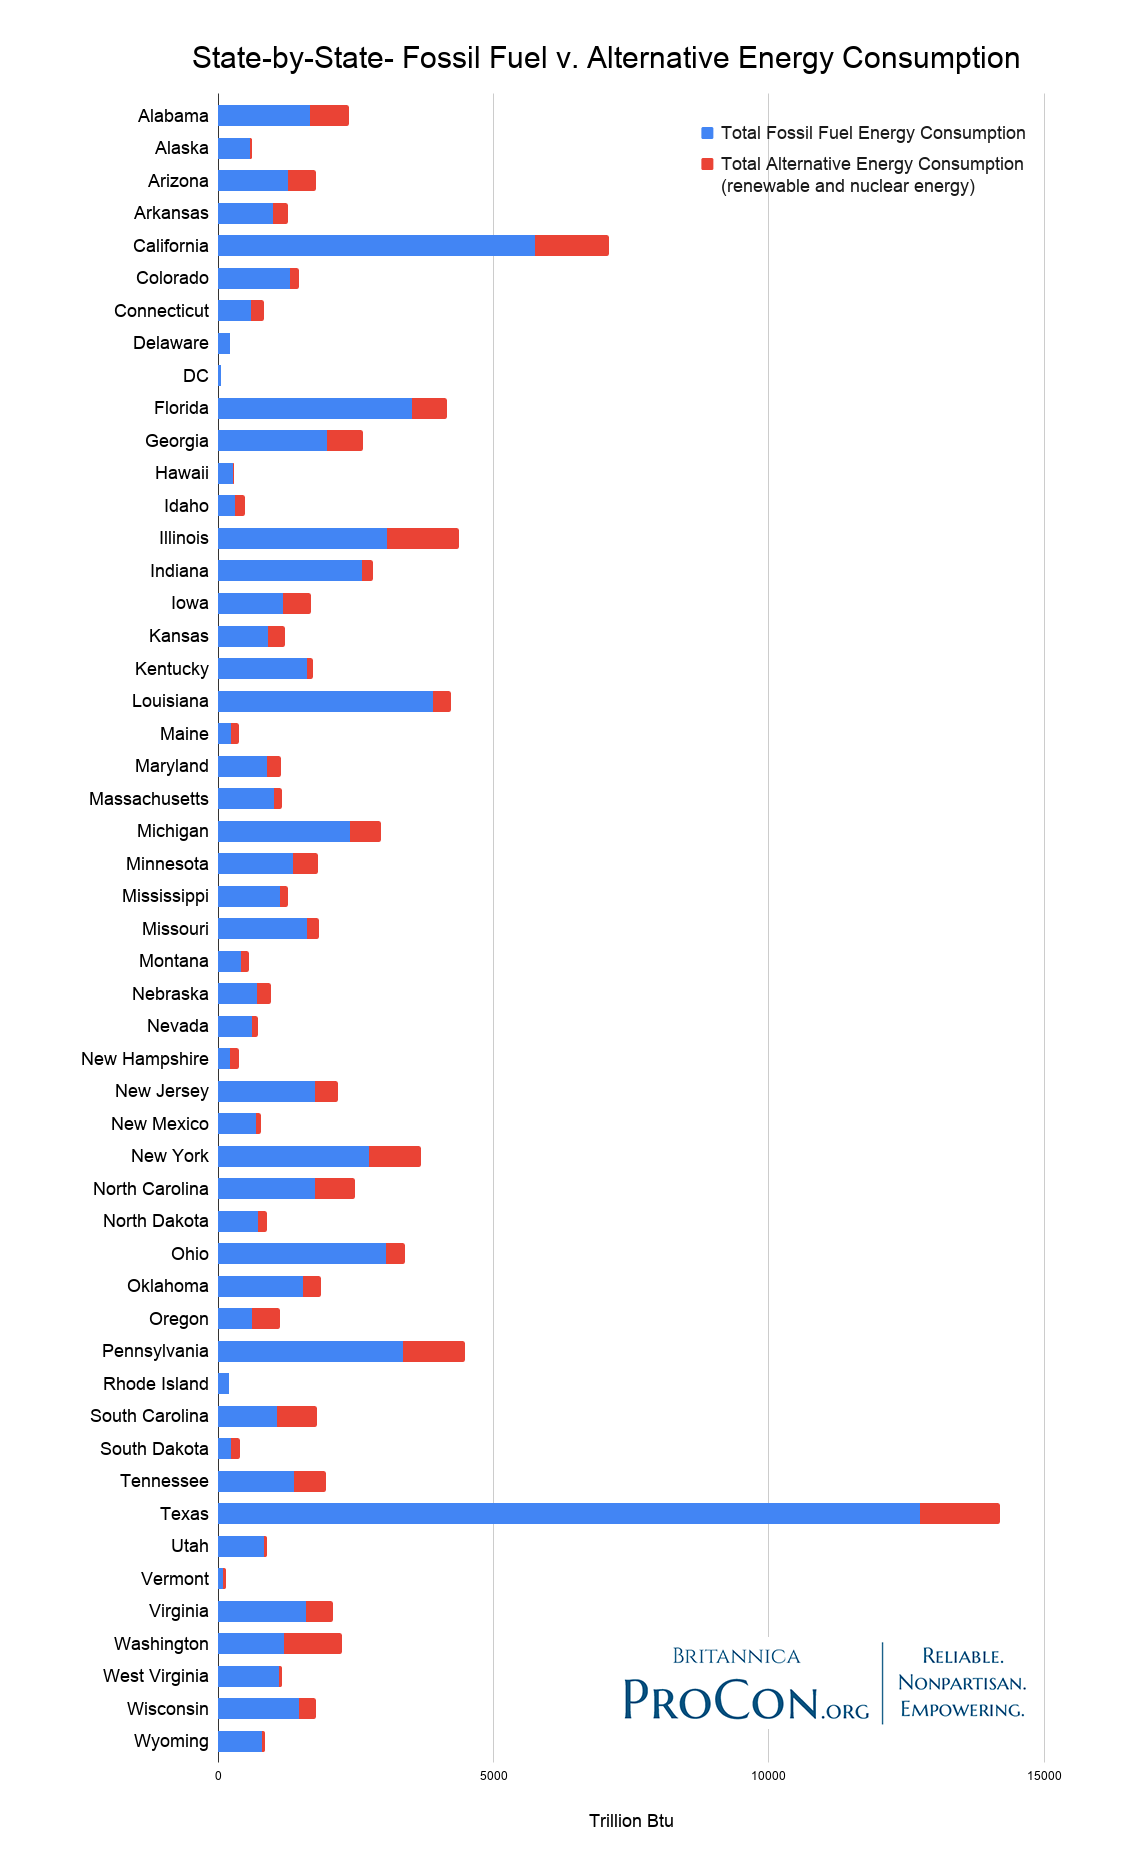
State-by State Population v. Energy Consumption
(energy totals are trillions of Btu)
*Total energy use includes electricity net gains/losses due to interstate electricity flow and electricity traded with Canada and Mexico, and thus may not equal the fossil fuel energy added to the alternative energy total.
| State | Population | Total Energy Consumption | Total Fossil Fuel Energy Consumption | Total Alternative Energy Consumption (renewable and nuclear energy) |
|---|---|---|---|---|
| Alabama | 4,887,681 | 1,954.8 | 1,667.6 | 711.0 |
| Alaska | 735,139 | 609.8 | 584.8 | 25.0 |
| Arizona | 7,158,024 | 1,487.8 | 1,271.6 | 503.6 |
| Arkansas | 3,009,733 | 1,119.7 | 1001.0 | 256.8 |
| California | 39,461,588 | 7,966.6 | 5,753.5 | 1,344.9 |
| Colorado | 5,691,287 | 1,513.3 | 1,305.1 | 164.6 |
| Connecticut | 3,571,520 | 753.0 | 602.7 | 226.9 |
| Delaware | 965,479 | 290.3 | 213.1 | 8.0 |
| DC | 701,547 | 174.5 | 51.7 | 2.7 |
| Florida | 21,244,317 | 4,281.3 | 3,526.9 | 624.0 |
| Georgia | 10,511,131 | 2,876.1 | 1,975.8 | 661.7 |
| Hawaii | 1,420,593 | 292.9 | 261.8 | 31.1 |
| Idaho | 1,750,536 | 553.3 | 299.4 | 178.9 |
| Illinois | 12,723,071 | 4012.0 | 3,060.6 | 1310.4 |
| Indiana | 6,695,497 | 2,837.6 | 2,617.2 | 185.9 |
| Iowa | 3,148,618 | 1,616.1 | 1,170.5 | 514.6 |
| Kansas | 2,911,359 | 1,134.5 | 894.6 | 316.2 |
| Kentucky | 4,461,153 | 1,743.9 | 1,616.5 | 102.1 |
| Louisiana | 4,659,690 | 4403.2 | 3,895.5 | 334.3 |
| Maine | 1,339,057 | 395.3 | 224.1 | 160.4 |
| Maryland | 6,035,802 | 1,361.2 | 885.7 | 247.1 |
| Massachusetts | 6,882,635 | 1,458.6 | 1,014.2 | 151.6 |
| Michigan | 9,984,072 | 2,894.2 | 2,394.3 | 569.1 |
| Minnesota | 5,606,249 | 1,913.9 | 1,358.6 | 454.9 |
| Mississippi | 2,981,020 | 1192.7 | 1,116.6 | 149.1 |
| Missouri | 6,121,623 | 1847.8 | 1,608.7 | 219.9 |
| Montana | 1,060,665 | 435.2 | 415.8 | 147.1 |
| Nebraska | 1,925,614 | 914.6 | 702.8 | 252.4 |
| Nevada | 3,027,341 | 727.2 | 605.6 | 117.3 |
| New Hampshire | 1,353,465 | 324.7 | 214.4 | 167.3 |
| New Jersey | 8,886,025 | 2,240.7 | 1,751.4 | 421.3 |
| New Mexico | 2,092,741 | 702.8 | 677.4 | 95.2 |
| New York | 19,530,351 | 3,854.2 | 2739.3 | 939.0 |
| North Carolina | 10,381,615 | 2,616.1 | 1,762.8 | 713.1 |
| North Dakota | 758,080 | 661.0 | 727.6 | 160.5 |
| Ohio | 11,676,341 | 3,755.9 | 3,040.2 | 350.1 |
| Oklahoma | 3,940,235 | 1,706.5 | 1,544.5 | 317.9 |
| Oregon | 4,181,886 | 1,012.2 | 621.1 | 496.8 |
| Pennsylvania | 12,800,922 | 3,961.6 | 3,360.4 | 1,123.9 |
| Rhode Island | 1,058,287 | 197.4 | 189.2 | 10.0 |
| South Carolina | 5,084,156 | 1,671.8 | 1071.4 | 714.7 |
| South Dakota | 878,698 | 396.8 | 237.6 | 149.5 |
| Tennessee | 6,771,631 | 2,255.9 | 1,374.8 | 584.2 |
| Texas | 28,628,666 | 14,258.8 | 12,752.2 | 1,439.6 |
| Utah | 3,153,550 | 835.1 | 830.0 | 61.3 |
| Vermont | 624,358 | 139.2 | 90.6 | 44.2 |
| Virginia | 8,501,286 | 2,401.2 | 1,592.6 | 487.3 |
| Washington | 7,523,869 | 2,078.7 | 1,197.2 | 1,058.3 |
| West Virginia | 1,804,291 | 832.9 | 1,103.2 | 53.7 |
| Wisconsin | 5,807,406 | 1,885.9 | 1,470.4 | 305.5 |
| Wyoming | 577,601 | 558.6 | 793.2 | 54.9 |
| United States | 326,687,501 | 101,083.6 | 81,212.3 | 19,719.7 |
Sources:
US Census Bureau, “Annual Estimates of the Resident Population for the United States, Regions, States, and Puerto Rico: April 1, 2010 to July 1, 2019 (NST-EST2019-01),” census.gov, Dec. 2019
US Energy Information Administration, “State Energy Consumption Estimates, 1960 through 2018,” eia.gov, June 2020
US Energy Information Administration, “Table C3. Primary Energy Consumption Estimates, 2018 (Trillion Btu),” eia.gov (accessed Aug. 19, 2020)
US Energy Information Administration, “Units and Calculators Explained: British Thermal Units (Btu),” eia.gov, June 4, 2020